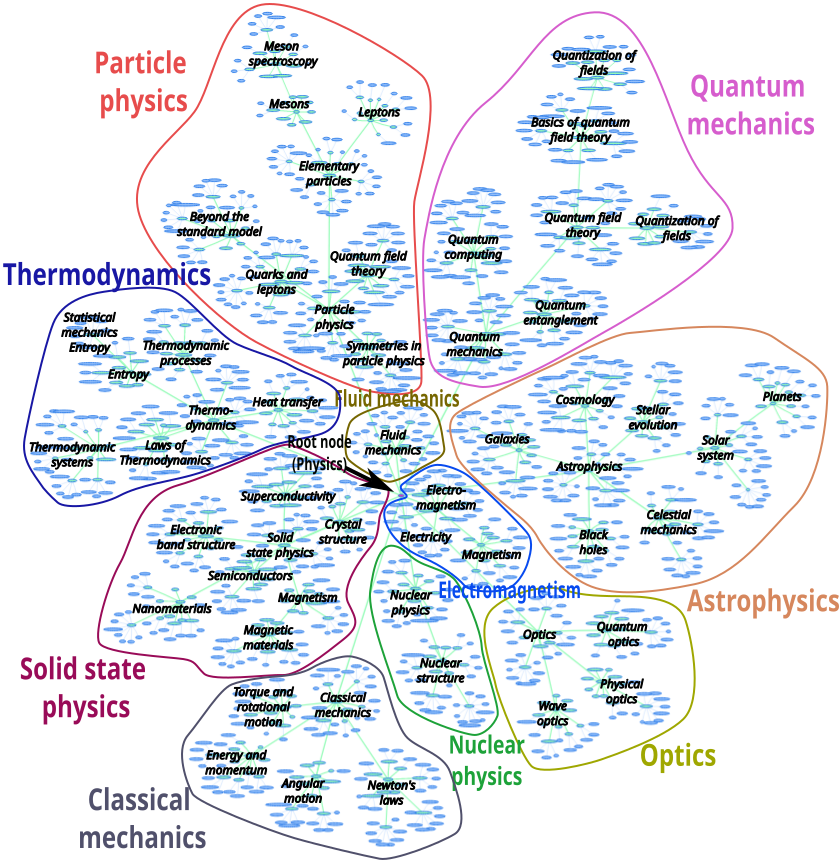
Visualization of the subtopic trees
The subtopic trees can be visualized as graph using the vis.js library. Thereby the leaf nodes of the subtopic tree are colored in blue while the junction nodes are colored in blue. The graphic below shows an overview over the subd tree. The root node, which is colored in pink can be seen in the right center.
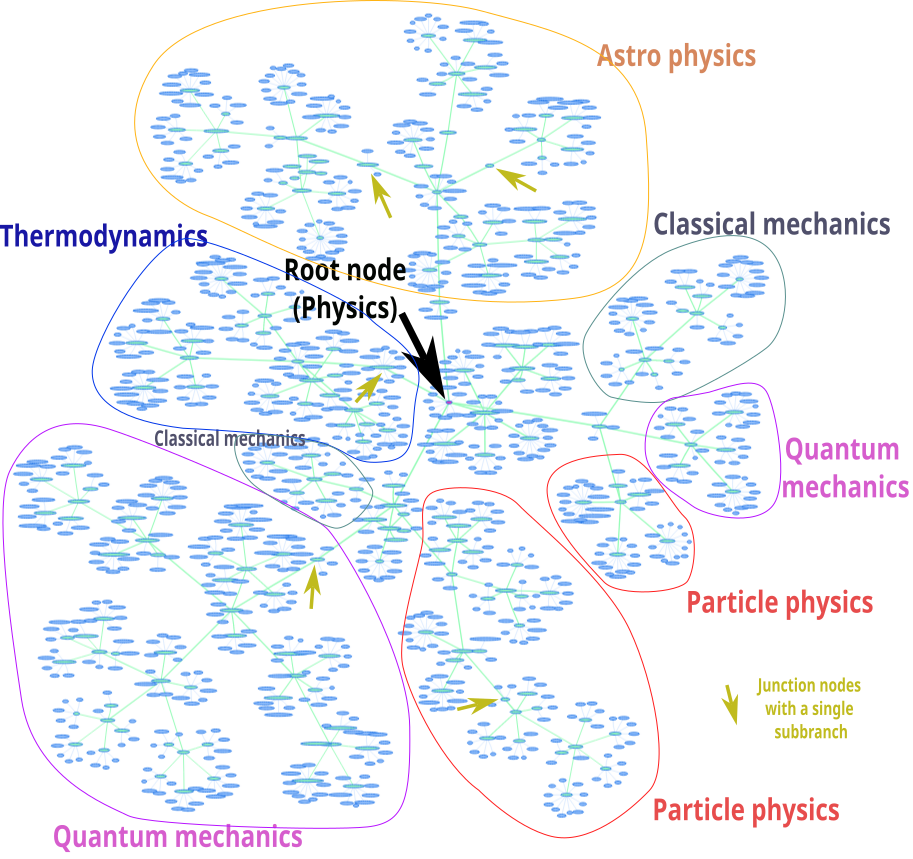 The image shows the irregular structure of the subtopic tree generated by the subdivision algorithm. Some branches are longer than others