Comparison of the frAss and subd algorithm for different values of the maxChildNumber parameter
|
|
|
|---|
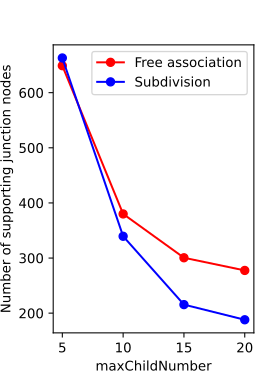
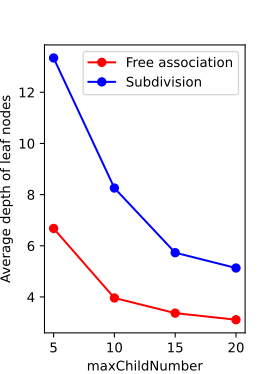
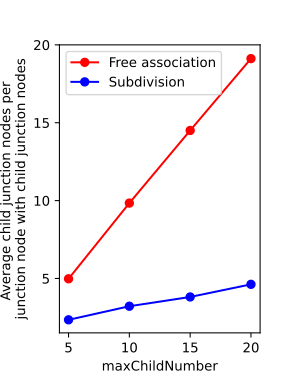
Different properties of the subtopic trees created by the free association algorithm and the subdivision algorithm in dependence of the maxChildNumber. The plotted properties are averaged over two subtopic trees created with the same parameter settings. The error bars are not shown because the low number of data points does not allow for a reliable error statistics for the different values of the maxChildNumber parameter. However, by comparing the pairs of subtopic trees created with the same parameter settings the rough estimation can be made that the error is in all cases smaller than 10%.
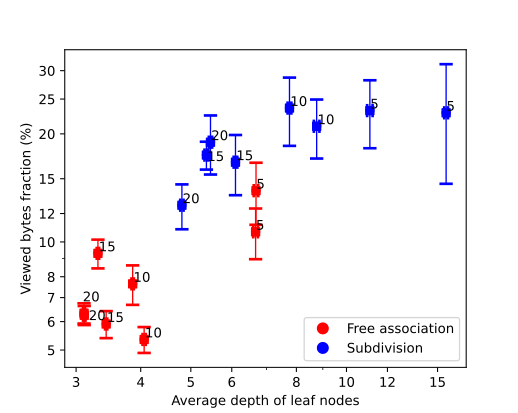 The viewed bytes fraction plotted against the average depth of the leaf nodes for different values of the
 maxChildNumber parameter of the subdivision algorithm (blue) and the free association algorithm (red). The y axis is shown with logarithmic scaling.
Tree |
Average term depth |
Average number of sub-junction-nodes per junction node with sub-junction-nodes |
Average viewed nodes fraction |
Average viewed bytes fraction |
Average choice correctness percentage |
|---|---|---|---|---|---|
frAss5 |
7.684 ± 0.0668 |
4.9809 ± 0.0191 |
13.05 ± 2.55% |
13.89 ± 2.73% |
82.99 ± 1.79% |
frAss10 |
4.8593 ± 0.02 |
9.833 ± 0.167 |
7.697 ± 0.962% |
7.642 ± 0.962% |
76.62 ± 2.99% |
frAss15 |
4.3064 ± 0.0176 |
14.481 ± 0.519 |
10.189 ± 0.929% |
9.295 ± 0.855% |
74.36 ± 2.47% |
frAss20 |
4.1108 ± 0.0172 |
19.1 ± 0.954 |
6.425 ± 0.388% |
6.25 ± 0.383% |
88.94 ± 2.13% |
subd5 |
12.097 ± 0.135 |
2.2508 ± 0.0702 |
20.52 ± 4.36% |
23.22 ± 4.98% |
79.01 ± 1.43% |
subd10 |
9.756 ± 0.108 |
3.036 ± 0.16 |
18.49 ± 3.46% |
21 ± 3.92% |
63.33 ± 2.23% |
subd15 |
7.1002 ± 0.0489 |
3.492 ± 0.235 |
13.59 ± 2.59% |
16.68 ± 3.18% |
77.74 ± 2.3% |
subd20 |
5.8054 ± 0.0353 |
4.846 ± 0.315 |
12.4 ± 1.74% |
12.66 ± 1.81% |
80.38 ± 2.23% |
This is a more systematic comparison of both algorithms then the previous evaluation of the subdivision algorithm and the free association algorithm.